
Analysis 31 January 2023
The crux of it is, IFM is attempting to move their old legacy parts and services business and leverage their data, existing world-wide business partnerships with car dealers, OEMs, and car manufacturers and turn themselves into a DaaS and SaaS provider. They are hoping to capture the industry trend to pre-emptive parts and servicing by connected cars, with EVs playing an ever increasing part in this. They appointed a new CEO at the start of FY22 to help do this. The new CEO has done something similar with BMW and worked at Google too, according to their media release. The previous analysis I have done on IFM in FY21 showed the industry is prime for consolidation and digitalisation.
| Earnings &Margins | 2018 | 2019 | 2020 | 2021 | 2022 |
| Sales Per Share $ | 0.24 | 0.27 | 0.25 | 0.26 | 0.32 |
| CFPS $ | 0.09 | 0.12 | 0.10 | 0.10 | 0.12 |
| EPS $ | 0.04 | 0.05 | 0.06 | 0.04 | 0.02 |
| Cash Conversation % | 76% | 101% | 84% | 75% | 94% |
| EBITDA % | 50.6% | 44.9% | 48.6% | 51.0% | 39.5% |
| EBIT % | 21% | 21% | 26% | 26% | 7% |
| NPAT % | 18% | 19% | 20% | 16% | 7% |
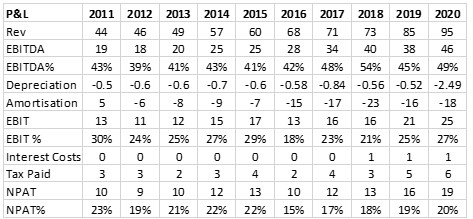
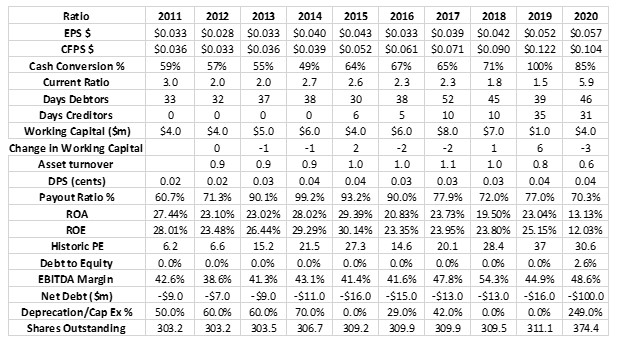
Since FY2018 IFM has grown revenue organically and through acquisitions. They have increased revenue from $72.9m in FY18 to $120.4m in FY22 (23% of FY22 revenue was generated by the Simple Part acquisition in FY21). For the most part, the increasing revenues has resulted in higher earnings, cash flow, and profits, as margins and cash flow conversion have remained stable. This has resulted in EBITDA increasing from $36.9m to $47.5m and profits remaining stable between the range of $12-18m. Things have taken a turn in FY22, and earnings and profit margins have fallen. This resulted in a 49% decrease in NPAT to $8.2m. According to IFM this was due to a $14m depreciation and amortisation non-cash expense, earnouts relating to Nidasa ($2m) and simple Part ($7m) acquisitions, and roughly $2m of costs attributed to takeover bid responses.
| Management | 2018 | 2019 | 2020 | 2021 | 2022 |
| Liquidity Ratio | 2.2 | 2.2 | 1.9 | 1.8 | 1.7 |
| Current Ratio | 1.9 | 1.5 | 5.8 | 4.3 | 3.3 |
| Days Debtors | 47 | 40 | 47 | 52 | 43 |
| Days Creditors | 10 | 34 | 16 | 19 | 17 |
| Working Capital ($m) | $7.4 | $1.4 | $8.0 | $8.9 | $8.5 |
| Change in Working Capital ($m) | 6 | -6.6 | -0.9 | 0.4 | |
| Deprecation/Cap Ex % | 130.9% | 87.6% | 91.6% | 85.8% | 141.1% |
| Effective Tax Rate % | 18% | 23% | 26% | 22% | -8% |
IFM is well managed and generates strong cash flows, this can also be seen in the cash conversion ratio above. This is allowing them to pay their creditors within 30-days and fund their working capital requirements. IFM have had a health capital expenditure program, as I have included amortisation in the depreciation amount and capitalised software costs in capital expenditure and capital expenditure over the period has mostly kept up with depreciation. IFM have not pain the full tote corporate tax rate of 30%, due to research and development tax incentives.
| Debt & Interest | 2018 | 2019 | 2020 | 2021 | 2022 |
| Debt to Equity | 0.0% | 0.0% | 3.8% | 5.6% | 4.3% |
| Net Debt ($m) | -$13.3 | -$15.5 | -$98.0 | -$58.2 | -$62.7 |
| Interest Coverage Ratio | 26 | 16 | 28 | 127 | 29 |
| Debt to EBITDA | 0.0 | 0.0 | 0.1 | 0.2 | 0.1 |
| Debt to Cash Flow | 0.0 | 0.0 | 0.2 | 0.2 | 0.1 |
As expected from a company that generates strong cashflows and can fund its business capital requirements internally they have no debt to speak of, except for leasing requirements. In 2020 IFM raised $85m through a corporate share placement and SPP to help fund their acquisitions and growth strategy and as of 31st Oct 2022 they had $55m cash in the tin.
| Dividends | 2018 | 2019 | 2020 | 2021 | 2022 |
| DPS $ | 0.03 | 0.03 | 0.04 | 0.04 | 0.05 |
| Payout Ratio % | 63% | 66% | 74% | 101% | 224% |
| Dividend Cover | 1.6 | 1.5 | 1.4 | 1.0 | 0.4 |
| DY % | 2.8% | 2.0% | 2.4% | 2.8% | 3.1% |
IFM have paid a consistent dividend which has generally been within the range of 60%-70% of profits, which is a prudent and sustainable level. FY21 and FY22 dividends have basically been paid by cash in the tin, as cash on hand since FY20 has fallen from $103m to $55m. Most likely, this has been done to keep corporate shareholders happy, that participated in the equity raising in FY20. IFM have hinted that FY23 will be another taught year regarding margin growth and is expecting EBITDA to remain under pressure from one-off restructuring and takeover bid response costs, but is expecting EBITDA margins to expand in FY24, as these costs are delt with. Hence their FY23 dividend may be a little light on compared to FY22, but as margins start to increase again in FY24, I would expect the dividend to follow suite.
| Assets & Equity | 2018 | 2019 | 2020 | 2021 | 2022 |
| Asset Turnover | 0.8 | 0.6 | 0.5 | 0.5 | |
| ROA | 19% | 19% | 13% | 13% | 5% |
| ROE | 24% | 25% | 12% | 10% | 6% |
| ROIA | 29% | 28% | 36% | 28% | 10% |
Return on assets and equity have been excellent to good, but of late has been treading downwards. Over the five-year period IFM have made some 4-5 business acquisitions some have been earnings accretive straight away such as Simple Part, but others have been more about the long-term transition to a SaaS and DaaS provider such as Nidasa; which is expected to create long-term value as IFM start to monetise and productise their data. Based this narrative and their FY23-24 forecasts, I will be expecting asset and equity returns to start increasing again from FY24, with this being a good sign that IFM is executing their growth strategy and creating value for shareholders.
| Valuation | 2018 | 2019 | 2020 | 2021 | 2022 |
| Price to Sales | 4.2 | 7.0 | 7.2 | 6.3 | 4.5 |
| EBITDA Multiplier | 7.9 | 15.2 | 12.7 | 11.2 | 10.0 |
| Historic PE | 22.1 | 33.0 | 30.5 | 35.6 | 73.3 |
| PEG Ratio | 1.3 | 3.1 | -1.4 | -1.5 | |
| Book Value $ | 0.18 | 0.21 | 0.41 | 0.41 | 0.39 |
| Share Price $ | 0.92 | 1.71 | 1.74 | 1.52 | 1.6 |
| Market Cap ($m) | 306.5 | 591.2 | 683.4 | 612.5 | 539 |
| EV ($m) | 293.2 | 575.7 | 585.4 | 554.3 | 476.3 |
| Cash Flow Multiple | 10.1 | 13.9 | 16.8 | 15.3 | 13.4 |
| Shares Outstanding (m) | 310 | 311 | 375 | 376 | 376 |
Looking at their previous multiples IFM has been expensive, and you have been paying to play. At the time of writing IFM share price was $1.13, trading on a PE of 26 times earrings, and has a market cap of $424.7m, suggesting the market is not as bullish on their new directions as it once was. Consensus forecasts has FY23 revenue and EPS at $129.9m and 4 cents respectively, with both revenue and EPS increasing to $141.1m and 6 cents in FY24. Furthermore the 12-month average price target is $1.46. For me all this is suggesting that there is still a bit of upside in IFM’s share price at its current level. Throw in their dividend too and it should be a sloid little performer over the next 2-3 years, if they can execute their new direction and growth strategy. Long-term you would think there is more upside here, given the direction they are going in and the company’s ability to turn revenue and earnings into cash flow, profits, and dividends. I don’t mind having a little nibble at them, given their current share price, and wait for more good news to buy more.
Interim Report 31st December 2022
The market liked IFM’s half yearly numbers sending the share price up nearly some 20c. It does seem things are on the improve and the new strategic direction is going well as ARR has increased and is now basically makes up 100% of revenue. Top line earnings, margins, and profits are up on HY21 and ROE and ROA have stabilised. ROA and ROE are curial to see improve from here, and return to their previous levels. This will be the test to see if the new direction and acquisitions are working and the business can return to its previous profitability. IFM has some work to do to get back to its previous high of $2.48 a share back in 2019. despite the health profit and earrings IFM did burn $9m in cash and cash conversion was down too. I would be looking for both these to improve come the annual 2023 report. But if earnings keep growing at their current rate and higher (not an easy task!!) and ROE and ROA keep improving and hopefully return to double digits, the share price will look after itself. IFM have constantly traded on a high PE valuation above 30 over the past 3-4 years. So you have to pay to play and any misses on consensus forecasts and forward guidance hurt the share price bit time. Having said this, this result is enough to tempt me to add a small parcel to my holding round the $1.40 mark and wait for further good news:
Notes:
Revenue up 6.7% to $62.9m (HY21 $59.8)
EBITDA: $22m (HY21 $19.7M)
EBIT: $5.9m (HY21 $4.1m)
ARR $62.3m up 9.8% (HY21 ARR $56.7m)
No Debt
Cash on hand $57m, down $9m from HY21
Reported NPAT up 38.5% to 4.8m (HY21 Reported NPAT $3.5m) up mostly due to reduced acquisition earnout expenses (NPAT HY21 Ex-Earnouts $9m)
Net Cash From Operations $12.7m (20.3m) Reduced to mostly to higher supplier and employee costs on the back of acquisitions.
Margins:
EBITDA Margin: 34% (HY21 33%)
EBIT Margin: 9.3% (HY21 6.8%)
Profit Margin: 7.6% (HY21 5.8%)
Cash Conversation: 57% (HY21 100%)
ROE 3.1% (HY21 2.3%)
ROA 3.3% (HY21 2.1%)
Forecast Profit, Share Price, ROE and ROA on earnings guidance of $130m.
NPAT: (profit margin 15%) $19.5m
EPS: 5.2c (FY22 4.3c)
ROE: 13.7% (using 15% profit margin)
ROA: 14.6% (using 20% EBIT margin)
Share Price: $1.56 (using PE of 30, Current PE 37)
Analysis 17 FEB 2021
IFM is a global technology company based in Australian and develops aftersales electronic parts catalogues, service software, data analytics and business insights for the global automotive industry, using a SaaS business model. IFM is one of the few global technology companies specialising in both manufacturer parts and service solutions, they are well placed to capitalise on the disruptive trends and challengers facing the automotive industry. Since 2017 IFM has increased revenue and profit from $70.5m and $10.3m to $94.6m and $18.5m, respectively. In this time their share price has increased from $0.70 to $1.83, down from a high of $2.84 in 2019. A McKinsey & Company 2017 report into the aftermarket parts sector highlighted that the aftermarket parts sector was ripe for digital disruption:
“Moreover, the emerging markets will create new needs and pressure to act for the aftermarket industry. At the same time, its players will face challenges from the increasing pace of industry consolidation, especially in North America and Europe. In addition, players such as automotive suppliers that have long conducted business in a relatively stable environment will face a new type of competitive pressure from players at different stages of the aftermarket value chain as well as new players with, for example, digital-driven business models.”
In 2018 IFM acquired Nidasu, a data analytics company, to enable them to create further value, by crating a data insight business to accompany their current suite of SaaS products, and enable their users to unlock the value that lies within their data to better serves their customers by offering grater service and insights.
Financials:
DCF Valuation:
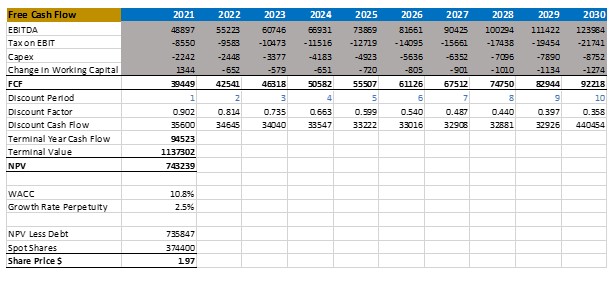
IFM has managed to grow their business and increase revenue, earnings, and profits while maintaining margins and generating strong returns on equity and assets. They have done this with out the use of debt and funded this growth through cash flow generated by the business. IFM had a capital raising in 2020 to help fund their strategic plan to develop a data insights business and create further value for shareholders. Consensus forecasts have IFM’s 2021 EPS and PE at $0.06 and 32 respectively, giving them a $1.92 share price valuation. IFM are in a strong position to capitalise on the disruption occurring in the automotive and aftermarket parts industry. With strong cash flows and zero net-debt, if IFM can execute their strategic plan there is upside in their share price, but currently it looks like they are at fair value.
Disclaimer: Rational Share Investing With Ratios does not hold an AFSL and information on this site should not be considered financial advice, personal or general, and represents the views of the author.
My Research Tool and Data Source of choice is: