Search For Posts, Update, & Reports
- ASX 300 Model Quarterly Portfolio Up Date
- Concentrated Portfolio Update
- Economic News & Updates
- Insights & Strategy
- Stock Reports
To receive all the latest updates and posts subscribe to my website for free. Only subscribers will receive individual stock reports, and video content. Below is a taste of what you will receive when you become a subscriber.
What Drives the Share Market?
30th March 2025 By Anton Crabbe
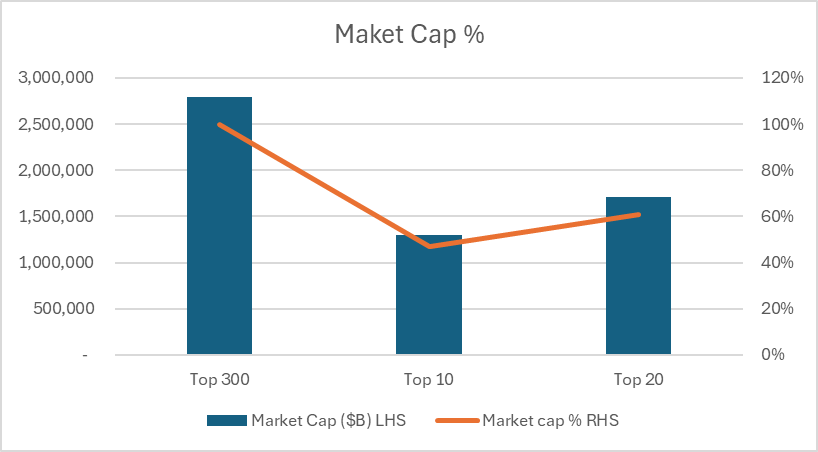
It is commonly known that the ASX is a concentrated market with large blue chip stocks making up most of the index weighting or market capitalization. A quick look at the ASX300 tells us that the top 10 stocks account for 47% of the index and the top 20 stocks account for 61% of the index, this is based on market capitalization.
But the stock market is a forward looking beast that factors in forward earnings and profits when valuing stocks. As such, I thought I would look at the most profitable stocks on the ASX 300.
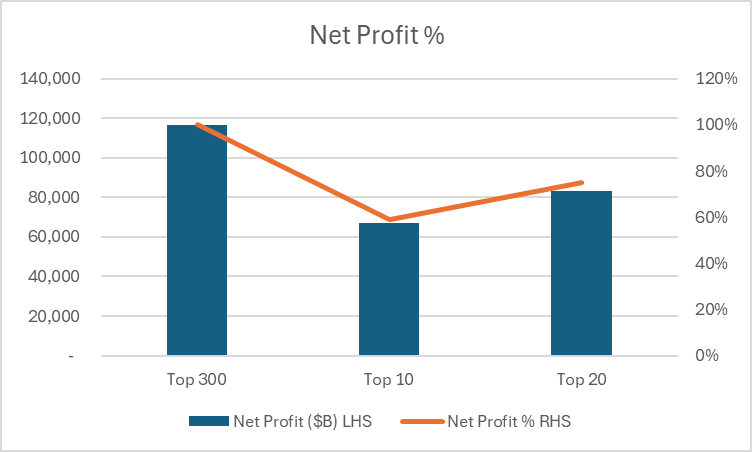
Unlike the overall market where unprofitable stocks account for most of the listed companies the majority of the top 300 stocks are profitable and all of the top 10 and 20 stocks are profitable companies. With the top 10 stocks of the ASX300 accounting for 59% of ASX300 profits and the top 20 stocks account for 75% of ASX300 profits.
Given that forward earnings and profits are used by the market to determine valuations and that the concentration of ASX300 profits is greater than market capitalization. To determine the direction of the overall market. Look no further than the profitability of the largest companies on the ASX and their forward guidance.
I am a fundamentally driven investor and find it hard to identify value stocks on the ASX and for the most part believe the majority of the companies on the ASX are either fair value or over valued. But I am not expecting there to be any major market crash anytime soon, unless you get an event similar to COVID or the GFC where the forward earnings and profits of our top companies are severely impacted.
Tariffs, tax’s , and hard and soft commodity prices movements will impact earnings and profits and can result in stock price and market corrections but for a major crash to occur you would need to see the forward earnings and profits of all the top companies in our index to be servilely impacted by 30-40% or more.
Tables
| Net Profit ($B) LHS | Net Profit % RHS | |
| Top 300 | 116,690 | 100% |
| Top 10 | 67,131 | 59% |
| Top 20 | 83,082 | 75% |
| Market Cap ($B) LHS | Market cap % RHS | |
| Top 300 | 2,789,246 | 100% |
| Top 10 | 1,301,713 | 47% |
| Top 20 | 1,707,396 | 61% |
Game On for Aristocrat Leisure (ASX:ALL)
3rd May 2025 by Anton Crabbe
Intro:
Aristocrat Leisure Limited (ASX:ALL) are an Australia-based global entertainment and gaming content creation company. The Company offers a range of products and services, including electronic gaming machines, casino management systems, free-to-play mobile games and online real money games and has been a listed company on the ASX since 2006 and at the time of writing had a market cap of $42.0b. ALL generates revenue from three business segments spanning regulated land-based gaming (Aristocrat Gaming), mobile games publishing (Pixel United), and regulated online real money gaming (Aristocrat Interactive).
In FY24 ALL conducted a strategic review of part of their business which resulted in the sale of Plarium Global Limited for US$600m. They also acquired Nasdaq-listed NeoGames for $1.8bn, and have indicated that they are on the hunt for more acquisitions with the US based entertainment machine business Interblock valued at $1bn being in the crosshairs, according to one news article.
According to ALL the NeoGames acquisition was a strategic one offering synergies and competitive advantages to the Aristocrat Interactive business segment:
“The acquisition of NeoGames brought unique capabilities, competitive advantages and growth opportunities to Aristocrat, and will further enhance our scale, resilience and customer relationships in this strategically important segment over the coming years.”
ASX Market Release: 2024 AGM
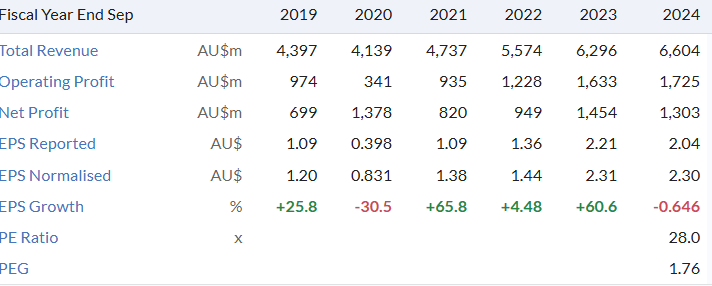
ALL had total revenue of $6.6b in FY24 which was up on FY23’s $6.2b but due to intangible asset write downs, resulting from the NeoGames acquisition, reported NPAT of $1.3b was down on FY23’s $1.4b. Underlying NPAT for FY24 was $1.5b, up on FY23’s $1.3b.
Each business segment contributed to ALL’s strong financial performance, with Gaming leading in revenue and profit growth, Pixel United showing resilience in challenging markets, and Interactive achieving significant growth through strategic acquisitions and scaling efforts, ALL stated in their FY24 annual report.
Business Segments and Financial Performance:
1. Aristocrat Gaming
- Activities: Develops, manufactures, and distributes regulated land-based slot games globally. Offers electronic gaming machines, casino management systems, and related services.
- Revenue: $3.6b in 2024 (up 4.8% from 2023).
- Segment Profit: $2.0b in 2024 (up 8.5% from 2023).
- Key Drivers: Exceptional growth in North America Gaming Operations, driven by expansion in Class III Premium and Class II installed base.
2. Pixel United
- Activities: Operates as a free-to-play, mobile-first games business. Includes Product Madness, and Big Fish Games, spanning genres like social casino, RPG, strategy, and casual games.
- Revenue: $2.6b in 2024 (down 0.5% from 2023).
- Segment Profit: $958.8m in 2024 (up 12.2% from 2023).
- Key Drivers: Strong performance in social casino franchises and RAID: Shadow Legends™, supported by user acquisition optimisation and operational efficiency.
3. Aristocrat Interactive
- Activities: Focuses on regulated online Real Money Gaming (RMG), including iLottery, iGaming, and Online Sports Betting. Provides content, proprietary technology platforms, and value-added services.
- Revenue: $335.7m in 2024 (up 83.8% from 2023).
- Segment Profit: $104.4m in 2024 (up 236.8% from 2023).
- Key Drivers: Integration of NeoGames acquisition, scaling iGaming across North America and Europe, and growth in platforms and content.
Geographically ALL generates most of its revenues and profits in the USA. FY24 saw them generate $4.9b in revenue from the USA, which accounted for 75.4% of the total revenue and generated $2.3b of profit, representing 75.2% of profits in FY24. It’s not surprising then, ALL sees the North America market as a key plank to future growth.
StcokRank:
Over the last 6-years ALL has increased revenue and earnings while maintaining an operating margin in the low to mid 20s. This has also help contributed to their strong returns on equity, assets, and capital employed.
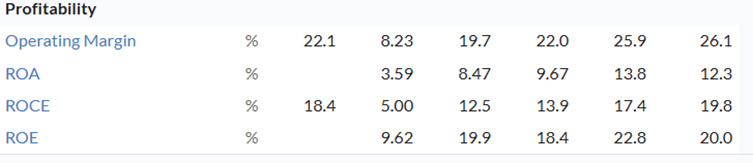
Given this performance it’s not surprising to see NPAT increase from $699m in FY19 to $1.3b in FY24. During this time and on the back of this strong financial performance, ALL’s share price has gone from $22.00 in FY19 to $65.00 at the time of writing.
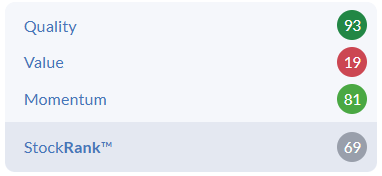
Looking at ALL’s stock rank numbers, this performance has not been lost on the market. With quality sitting at 93 and value at 19. Indicating the market sees ALL as a high performing stock but you have to pay to play, as the valuation is not cheap. Momentum does look to be on ALL’s side and has driven their share price to all-time highs in FY25. All up, this results in an overall StockRank of 69, with the valuation figure of 19 bring their StockRank number down for a company of this quality.
Financials:
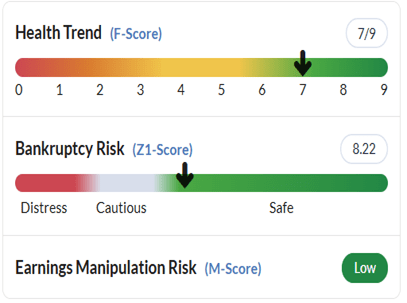
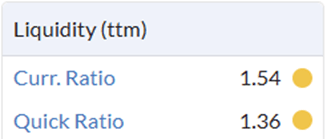
As you would expect with a company that has a quality score of 93, ALL are in good financial shape. Their F-Score has fallen on the back of cash on hand falling from $3.1b to $952m. This was due to the acquisition of NeoGames. The contraction of cash on hand has also hit their Z-Score and liquidity ratios. But as the benefits of the NeoGames acquisition start to flow through in their FY25 numbers. These scores and ratios should start to improve again. But something to keep an eye.
Looking at ALL’s cash flow however, does help alleviate any asset liquidity concerns, one might have. As ALL have increased revenue and earnings, they have converted this to increased operating cash flow and free cash flow. Which has allowed them to undertake two share buy-backs worth $2.6b and pay down US$250m of debt before its maturity in 2029. Before paying down debt ALL had gross gearing of 38.3%.
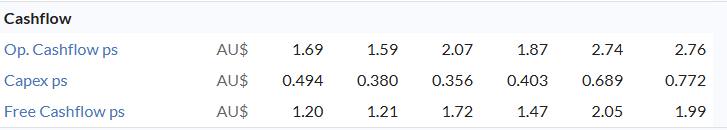
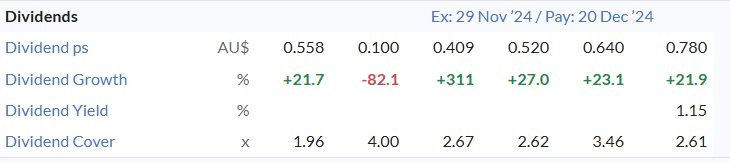
ALL does require substantial amounts of capital to run their business. As they are consistently designing, developing, and marketing new games and systems for their clients, customers, and users. They also employ some 8,500+ staff. This can be seen in their Capex ps increasing. However, ALL are in control of their costs and capex requirements as they have increased and maintained their operating margin and produced increasing cash flows. Part of this prudent financial management has been their restraint in not paying excessive dividends, while, still managing to increase dividend payments. With their dividend cover comfortable remaining over 2 except for 2019.
Based on the above, it does look like that the board and shareholders are aligned, and the business is being run well and for the benefit of shareholders.
Liquidity and Ownership:
ALL has $629.3m share on issue of which 88.2% are classified as free float and can be traded. With a market cap of $42.0b at the time of writing and an average of 1.3m shares traded per day over the last 3-months. They are in the big end of town and a small retail investor will have no issues buying or selling shares.
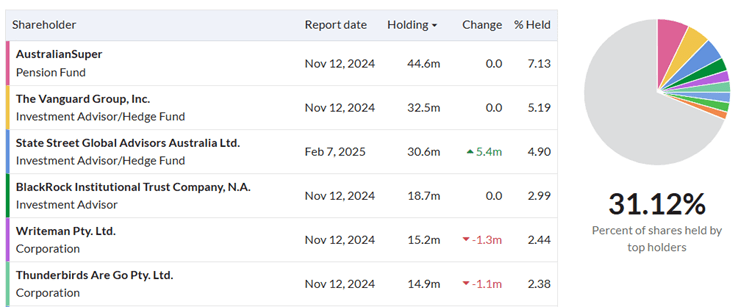
The top shareholders account for 31.12% of issued shares and their largest shareholder holds 7.13%. Of note, the top four shareholder are some of the biggest names in the investment and superannuation industries.
Outlook:
ALL are a design and development (D&D) led company. That constantly needs to keep spending so they can deliver new and unique products, systems and games into their business segments. ALL does see growth across all their business segments and are particularly focused on online real money gaming (RMG). ALL have not provided any forward guidance numbers for FY25.
Consensus estimates dose have profits coming in at $1.6b and $1.8b for FY25 and FY26 and of the 15 brokers that cover the stock have either and buy or strong buy recommendation.
Conclusion:
ALL are a well run and very profitable business with a track record of maintaining and growing revenue, earnings, profits, and are a leader in their field with a dominate market position. The growth opportunities appear to be there with ALL focused-on growth existing market share and entering new markets. For me, ALL’s track record and strong financials, coupled with upbeat consensus estimates and strong broker buy recommendations are more than enough to indicate that ALL are a company that will continue to grow and create wealth for shareholders and would fit comfortably in most portfolios.
Disclaimer: Rational Share Investing With Ratios does not hold an AFSL and information on this site should not be considered financial advice, personal or general, and represents the views of the author.
Reference to specific securities (if any) is included for the purpose of illustration only and should not be construed as a recommendation to buy or sell the same. All securities mentioned herein may or may not form part of my holdings at a certain point in time, and the holdings may change over time.
My Research Tool and Data Source of choice is: Stockopeida
Rational Share Investing With Ratios
Proudly Powered by WordPress
